

A perfect storm of dwindling inventory, economic rebound, and bottom-dollar mortgage rates have pushed Oahu’s median prices to new record highs — $992,500 for single-family homes and $475,000 for condos.
While 30-year term mortgage rates below 3% — under 2.5% in some cases — have significantly offset affordability challenges with lower monthly payments, there’s a surprising wrinkle in the inventory story. Specifically, what segment of the market inventory is actually shrinking,
According to Shannon Heaven, president, Honolulu Board of Realtors®. “We’re seeing these record-high sales prices because inventory in the affordable and mid-range price brackets are dwindling.”
The disparity in single-family inventory by price range for July, as compared to last year, is unmistakable.
| Single Family | July 2021 | July 2020 | % Difference |
| $350,000 and below | 8 | 12 | -33.3% |
| $350,001 – $475,000 | 6 | 24 | -75.0% |
| $475,001 – $550,000 | 19 | 32 | -40.6% |
| $550,001 – $650,000 | 30 | 91 | -67.0% |
| $650,001 – $800,000 | 101 | 176 | -42.6% |
Last month, 70% of single-family homes sold above the asking price. While offers above asking were common across all price points, they were especially prevalent in sales below the median sales price of $992,500. During that same month, 38% of condo sales closed above the asking price, compared to 14% in July 2020.
With the MSP bar raised, single-family homes listed below the median price — currently Leeward, Waipahu and Ewa regions — are selling fast. Meanwhile, the neighborhoods where most sales exceed the record median sale price were properties in Hawaii Kai, Kailua, North Shore, and Diamond Head regions. Statistically, the MSP is pushed higher when inventory in the lower end of the spectrum dries up.
Kalama Kim, principal broker at Coldwell Banker Realty, points out the factors affecting our market include the pandemic, and, more to the point, he adds, “The uncertainty of when the pandemic will end or subside.”
“The market continues to be very unpredictable,” Kim says. “The July stats show that pending sales are beginning to slow, and new listings are beginning to rise. However, these changes are small and marginal, and we don’t know if this trend will continue.”
Mike James, president of Coldwell Banker Realty, adds, “While we continue to see multiple buyers making offers on properties, the number of buyers competing for each listing has declined.
“Our agents continue to keep a pulse on the market by networking within our company and our industry to identify signs that may indicate a shift in the market,” James says. “Those signs may include a decline in traffic at open houses, a decrease in showing requests, or even a decrease in phone inquiries.”
Sales of Single-Family Homes and Condos | July 2021
Source: Honolulu Board of REALTORS®, compiled from MLS data
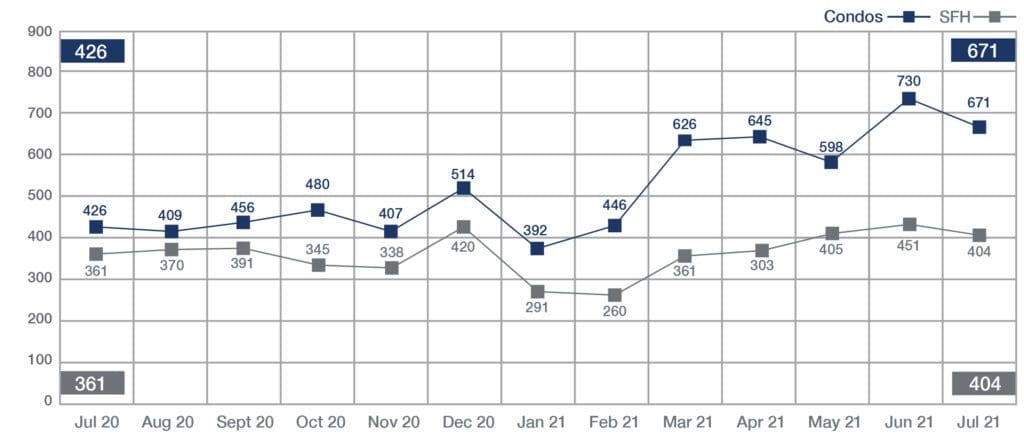
The number of homes and condos sold, year-over-year, is another variable in determining the condition and vigor of the market. In July, there were double-digit increases in sales for both segments, compared to a year ago. Last month, there were 404 single-family home sales, an increase of 11.9% over July 2020, when 361 homes closed. Condo sales increased by 57.5%, with 671 condos selling last month, compared to 426 a year ago.
In July, and year-to-date 2021, while both segments are significantly up, condo sales are booming, possibly due to affordability. After the first seven months of 2021, the number of single-family homes closed was up 29% over 2020, while closed condo sales gained 68.4%.
Median Sales Price of Single-Family Homes and Condos | July 2021
Source: Honolulu Board of REALTORS®, compiled from MLS data
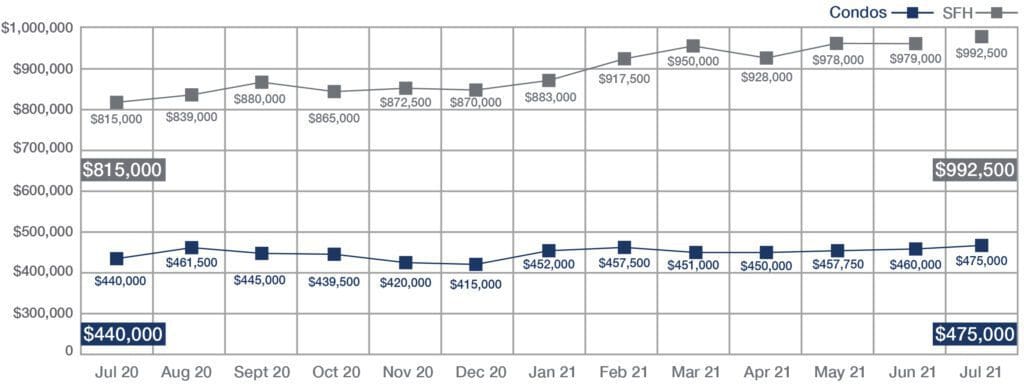
July was record-breaking for single-family home and condo prices. Increasing to $992,500, July single-family homes MSP beat the previous record, set in June of $979,000.
July’s MSP was a 21.8% increase over the MSP in July 2020 of $815,000 — a stunning increase of $177,500 in one year. The median price of a condo hit a new record of $475,000 in July, breaking the previous record set in June of $460,000.
NEIGHBORHOOD MARKET STANDOUTS
HBR notes when single-family inventory in the affordable and mid-range price brackets become depleted, median prices rise. This month, we shift focus from island neighborhoods to price points that are standing out — redefining our housing market.
Inventory of Homes for Sale
| Single Family | July 2021 | July 2020 | % Difference |
| $350,000 and below | 8 | 12 | -33.3% |
| $350,001 – $475,000 | 6 | 24 | -75.0% |
| $475,001 – $550,000 | 19 | 32 | -40.6% |
| $550,001 – $650,000 | 30 | 91 | -67.01% |
| $650,001 – $800,000 | 101 | 176 | -42.6% |
| $800,001- $1.1 million | 225 | 263 | -14.4% |
| $1.1M – $1.9M | 247 | 291 | -15.1% |
| $1.9 and above | 197 | 247 | -20.2% |
| Total | 833 | 1,136 | -26.7% |
| Condo | July 2021 | July 2020 | % Difference |
| $150,000 and below | 77 | 118 | -34.7% |
| $150,001 – $200,000 | 83 | 133 | -37.6% |
| $200,001 – $250,000 | 105 | 149 | -29.5% |
| $250,001 – $300,000 | 118 | 165 | -28.5% |
| $300,001 – $375,000 | 195 | 300 | -35.0% |
| $375,001 – $475,000 | 252 | 380 | -33.7% |
| $475,001 – $700,000 | 370 | 505 | -26.7% |
| $700,001 and above | 458 | 567 | -19.2% |
| Total | 1,658 | 2,317 | -28.4% |
SOURCE: Honolulu Board of REALTORS®, compiled from MLS data.


Leave A Comment