Single-family home and condo sales volume was strong in October — up 12.3% and 6.5%, respectively — according to the Honolulu Board of Realtors. Active listings increased in both segments last month as well, with majority of Oahu neighborhoods having more inventory than was available a year ago. Even with the influx of inventory, year-to-date prices hovered right around par — prices remaining comparable to the first 10 months of 2018, and with the median number of days on the market less than 30 days.
“We are definitely moving toward a balanced market between buyers and sellers,” says Kalama Kim, principal broker at Coldwell Banker Pacific Properties. “Buyers are enjoying extremely low mortgage interest rates, there are more homes to choose from, and they have ample time to make that choice, while sellers can be confident that if they price at market value they will be able to sell their property in less than a month.”
Of course, there are always neighborhoods bucking the trends and do better (or worse) than the overall medians for the island (we’ll call out some of these in Hot Markets below).
Two market segments that may give buyers an advantage, and some possible negotiating room, may not be easily gleaned from HBR’s monthly stats.
“Segments such as the over $2-million price point have a large amount of inventory, which could lead to value purchases,” says Kim. “Additionally, Bill 89 (the new law, which puts strict regulations on short-term rentals) may lead to additional inventory in neighborhoods like the North Shore where owners may choose to sell their investment properties rather than convert them into long-term rentals.”
Nationwide, housing trends also remain strong, according to Sam Khater, Freddie Mac’s chief economist. “Economic growth has slowed significantly across the globe, but the slowdown has been more muted domestically. In the United States, the slowdown has been caused by a contraction in manufacturing and a decline in business investment, partly due to weakening business confidence and uncertainty around the lack of a trade deal with China,” Khater says. “However, the housing market remains on solid ground with housing starts, building permits, existing home sales, and new home sales all outperforming the broader economy.”
Sales of Single-Family Homes and Condos | October 2019
Source: Honolulu Board of REALTORS®, compiled from MLS data
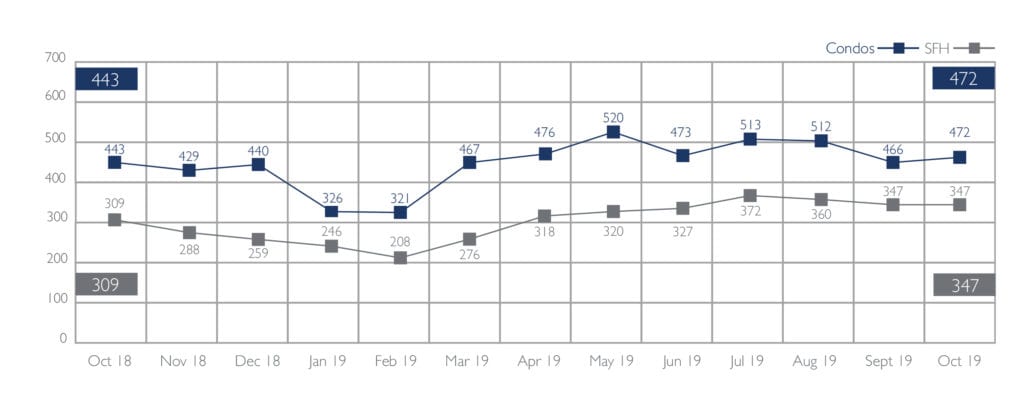
Despite the increase in inventory, or perhaps because of it, the number of single-family home transactions closed in October was up by a factor of 12.3%, from 309 closed sales in October 2018 to 347 last month. Year-to-date, the number of closings were up 1.9% — with 3,121 homes closed last month — very close to October 2018 figures of 3,062 homes closed.
The number of condo closings was also up from a year ago. Last month, 472 condos closed compared to 443 units closed in September 2018 — a 6.5% increase. Year-to-date, however, condo closings are down 5.5%.
Median Sales Price of Single-Family Homes and Condos | October 2019
Source: Honolulu Board of REALTORS®, compiled from MLS data
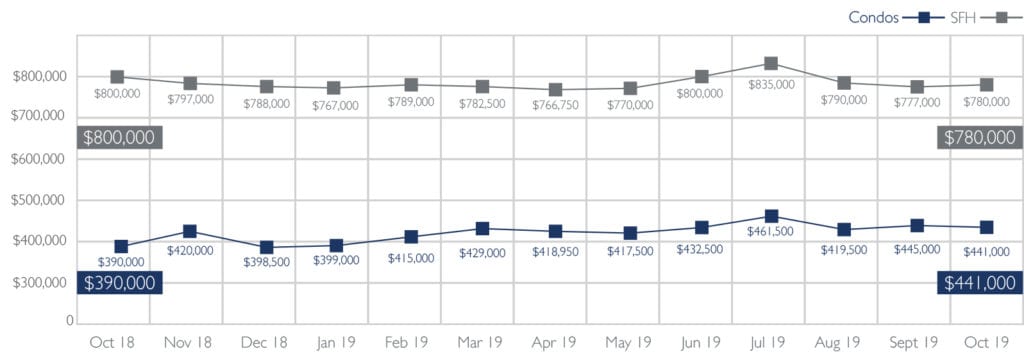
Year-to-date, the median sales prices of single-family homes and condos are neck-and-neck with this time last year.
The median sales price of a single-family home dropped 2.5% — from $800,000 in October 2018 to $780,000 last month. Year-to-date figures are comparable with October 2018 when the year-to-date MSP was $790,000, compared with this year’s 10-month-median of $785,000 — a slim difference of -0.6%.
Condominiums prices have followed a similar path. Last month, the MSP of a condo on Oahu was $441,000, up 13.1% from October 2018’s MSP of $390,000. The year-to-date figures in 2019 are $428,000, only a 0.7% increase from 2018, when the year-to-date MSP was $425,000.
The percentage of the original list price versus sales price ratio is essentially unchanged —down less that 1% in both single-family and condo markets. Single-family home sellers received 98.0% of their original list price, and condo sellers received 98.2% of their original list price.
HOT MARKETS!
For many months, the inventory shortfall gave rise to bidding wars and lightning fast sales. More recently, rising inventory has allowed buyers more time to make decisions, and more homes from which to choose. Ample supply is an advantage for buyers and affords them more negotiating power.
In October, roughly 80% of the neighborhoods on Oahu had more inventory than a year ago. This month’s hot markets for buyers include neighborhoods where the number of homes for sale has increased by 25% or more from a year ago.
NOTE: The Honolulu Board of Realtors reports sales statistics on the Oahu market every month, for the previous month. Data for individual neighborhoods takes more time, hence the HBR report showing neighborhood-specific data pulls figures from September.
| Single-family homes in: | % increase | # of homes for sale 2019 vs 2018 | |
| Aina Haina — Kuliouou | 40% | 70 | 50 |
| Ala Moana — Kakaako | 33% | 4 | 3 |
| Kapahulu — Diamond Head | 39% | 121 | 87 |
| Moanalua — Salt Lake | 60% | 16 | 10 |
| North Shore | 44% | 91 | 63 |
| Waipahu | 25% | 66 | 53 |
| Windward Coast | 88% | 60 | 32 |
| _____________________ | |||
| Condos in: | |||
| Aina Haina — Kuliouou | 200% | 3 | 1 |
| Ala Moana — Kakaako | 31% | 306 | 234 |
| Hawaii Kai | 32% | 82 | 62 |
| Kalihi — Palama | 31% | 46 | 35 |
| Kaneohe | 52% | 88 | 58 |
| Makaha – Nanakuli | 25% | 89 | 71 |
| Makiki — Moiliili | 41% | 251 | 178 |
| North Shore | 25% | 35 | 28 |
| Windward Coast | 200% | 27 | 9 |
SOURCE: Honolulu Board of REALTORS® , compiled from MLS data.





Leave A Comment