
While 2019 was off to a sluggish start with sales volume declines carrying in from 2018, single-family home sales rebounded by year’s end with six consecutive months of increases, which brought total sales volume up .1 % for the year. Condo sales continued to lag with annual volume down by .5% Combined annual unit sales were 9,158 — a modest 1.4% decline from 2018.
The average 30-year fixed-rate mortgage interest rate in 2019 remained below 4%, a significant difference from 2018, when rates were on the rise and approaching 5%.
Though the overall number of sales decreased, new listings increased by 3.8% for single-family homes, and 4.5% for condos.
Monthly median sales price records were set in July 2019 — $835,000 for single-family homes, and $461,500 for condos — yet, the year ended essentially flat, with median prices near 2018 year-end figures. Single-family homes dipped from $790,000 in 2018, to $789,000 in 2019 — a slight decline of 0.1%. Year-end condo prices were up slightly from 2018 — from $420,000 a year ago, to $425,000 at the end of 2019.
Overall, market conditions remain stable moving into 2020.
“These conditions, paired with low interest rates and favorable economic conditions continuing to drive healthy market activity, create an advantageous environment where buyers have purchasing power and sellers have more potential buyers for their properties,” says Tricia Nekota, president of the Honolulu Board of Realtors®.
Kalama Kim, principal broker at Coldwell Banker Pacific Properties points out how conditions affecting affordability are the most attractive to buyers.
“Mortgage rates continue to be low and home values have been quite stable for some time now, giving buyers comfort when buying a home,” says Kim. Yet, some conditions point toward being advantageous to sellers.
“The months of remaining inventory (MRI), which measures how long it would take to sell all the current inventory on the market, is a great measure to determine whether it’s a buyer’s or seller’s market, Kim adds. “If the MRI goes down, sellers have the leverage in negotiations and vice versa for buyers. During December, the MRI dropped to 2.5 months from 2.8.”
Sales of Single-Family Homes and Condos | December 2019
Source: Honolulu Board of REALTORS®, compiled from MLS data

It was a busy December in the single-family home segment with closed sales shooting up 19.3% in December with 309 closed sales last month, compared to 259 in December 2018. Pending sales were also up — a dramatic 17.8% — from 376 pending in December a year ago, to 443 last month.
Last month, 428 condos closed, down slightly from 440 closed sales in December 2018. However, pending sales increased 5.2%, from 542 a year ago to 570 last month.
According to Kim, the most surprising stat from 2019 was that sales volume for the year ended up nearly 4% after beginning the year on the down side.
“That could be a positive sign for 2020,” says Kim. “Unlike the previous two years, pending sales were up for homes by 18% in December, which may be another sign that demand is still strong.”
Median Sales Price of Single-Family Homes and Condos | December 2019
Source: Honolulu Board of REALTORS®, compiled from MLS data

Single-family home prices gained 4.1%, from $788,000 in December 2018, to $820,000 last month. The median price of a condo was also up 6.8%, from $398,000 December 2018 to $425,500 last year.
For the first time since 2012, the annual median sales price for a single-family home dipped ever so slightly last year — down 0.1% from 2018.
Condo MSPs on the rise since 2012, increased for the eighth consecutive year — up 4.3% from the 2018 annual median.
The Honolulu Board of Realtors has been tracking such data since 1985, and the 35-year average change in median sales price computes to a gain of 4.69% per year in the single-family segment, and a 4.3% for condos.
HOT MARKETS!
This month’s hot markets are those neighborhoods where the 2019 median sales price outperformed Oahu overall — by 4% or more in condos, and 1% or more in single-family homes.
NOTE: The Honolulu Board of Realtors reports sales statistics on the Oahu market every month, for the previous month. Data for individual neighborhoods takes more time, hence the HBR report showing neighborhood-specific data pulls figures from November.
| Single-family homes in: | % increase |
| Kalihi-Palama | 1% |
| Kaneohe | 1% |
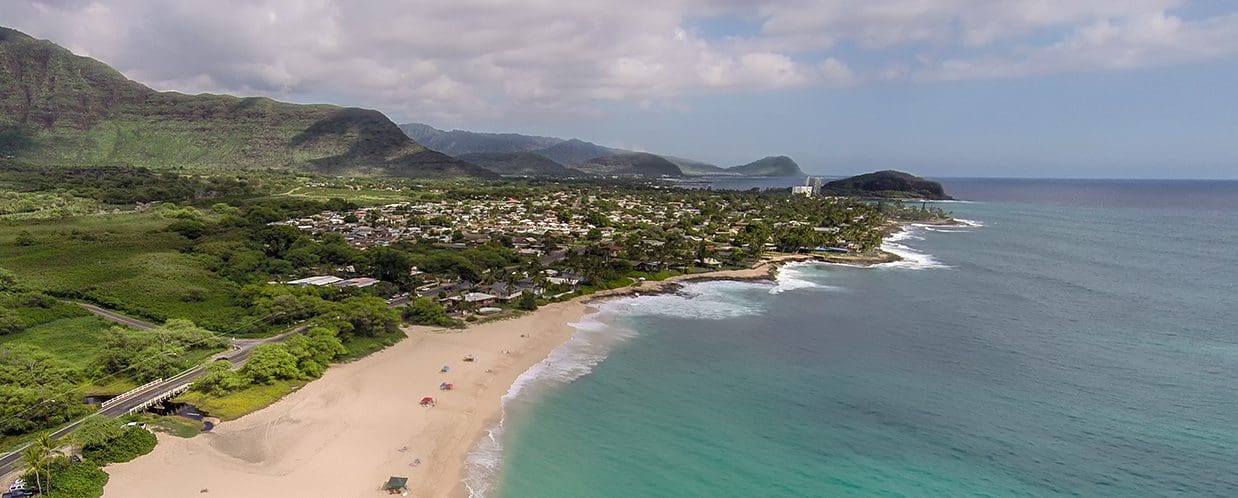
| Makaha-Nanakuli | 4% |
| Wahiawa | 6% |
| Waipahu | 1% |
| Condos in: | |
| Ala Moana-Kakaako | 4% |
| Downtown-Nuuanu | 9% |
| Makaha-Nanakuli | 7% |
| North Shore | 4% |
| Wahiawa | 7% |
| Windward Coast | 8% |


Leave A Comment